
KPIs That Matter: Measuring S&OP Performance
Sales and Operations Planning (S&OP) is a vital process that bridges the gap between different functions within an organization, aligning sales, marketing, finance, and operations to ensure smooth and efficient business operations. However, for S&OP to truly drive value, businesses need to have clear visibility into how well the process is performing. This is where Key Performance Indicators (KPIs) come in.
KPIs are the metrics that help organizations measure the effectiveness of their S&OP initiatives, ensuring they are meeting their goals, delivering value, and continuously improving. In this blog, we’ll define and explore the most critical KPIs for assessing S&OP performance and how they can be used to drive better decision-making and performance.
1. Forecast Accuracy
What it is: Forecast accuracy measures how closely actual demand matches the forecasts made during the S&OP process.
Why it matters: Accurate demand forecasting is the cornerstone of an effective S&OP process. Forecast accuracy directly impacts inventory levels, production schedules, and customer service. If forecasts are too high, businesses risk overstocking and tying up capital in unsold inventory. If forecasts are too low, they risk stockouts, missed sales, and dissatisfied customers.
How to measure it: Typically, forecast accuracy is calculated using Mean Absolute Percentage Error (MAPE), which compares the forecasted demand with the actual demand.
Formula:
MAPE=1n∑i=1n∣Actual Demandi−Forecast DemandiActual Demandi∣×100\text{MAPE} = \frac{1}{n} \sum_{i=1}^{n} \left|\frac{\text{Actual Demand}_i – \text{Forecast Demand}_i}{\text{Actual Demand}_i}\right| \times 100
Actionable Insight: Consistently high forecast accuracy leads to better resource utilization and higher customer satisfaction. If accuracy is low, you may need to revisit your forecasting methods or incorporate more real-time data to improve your process.
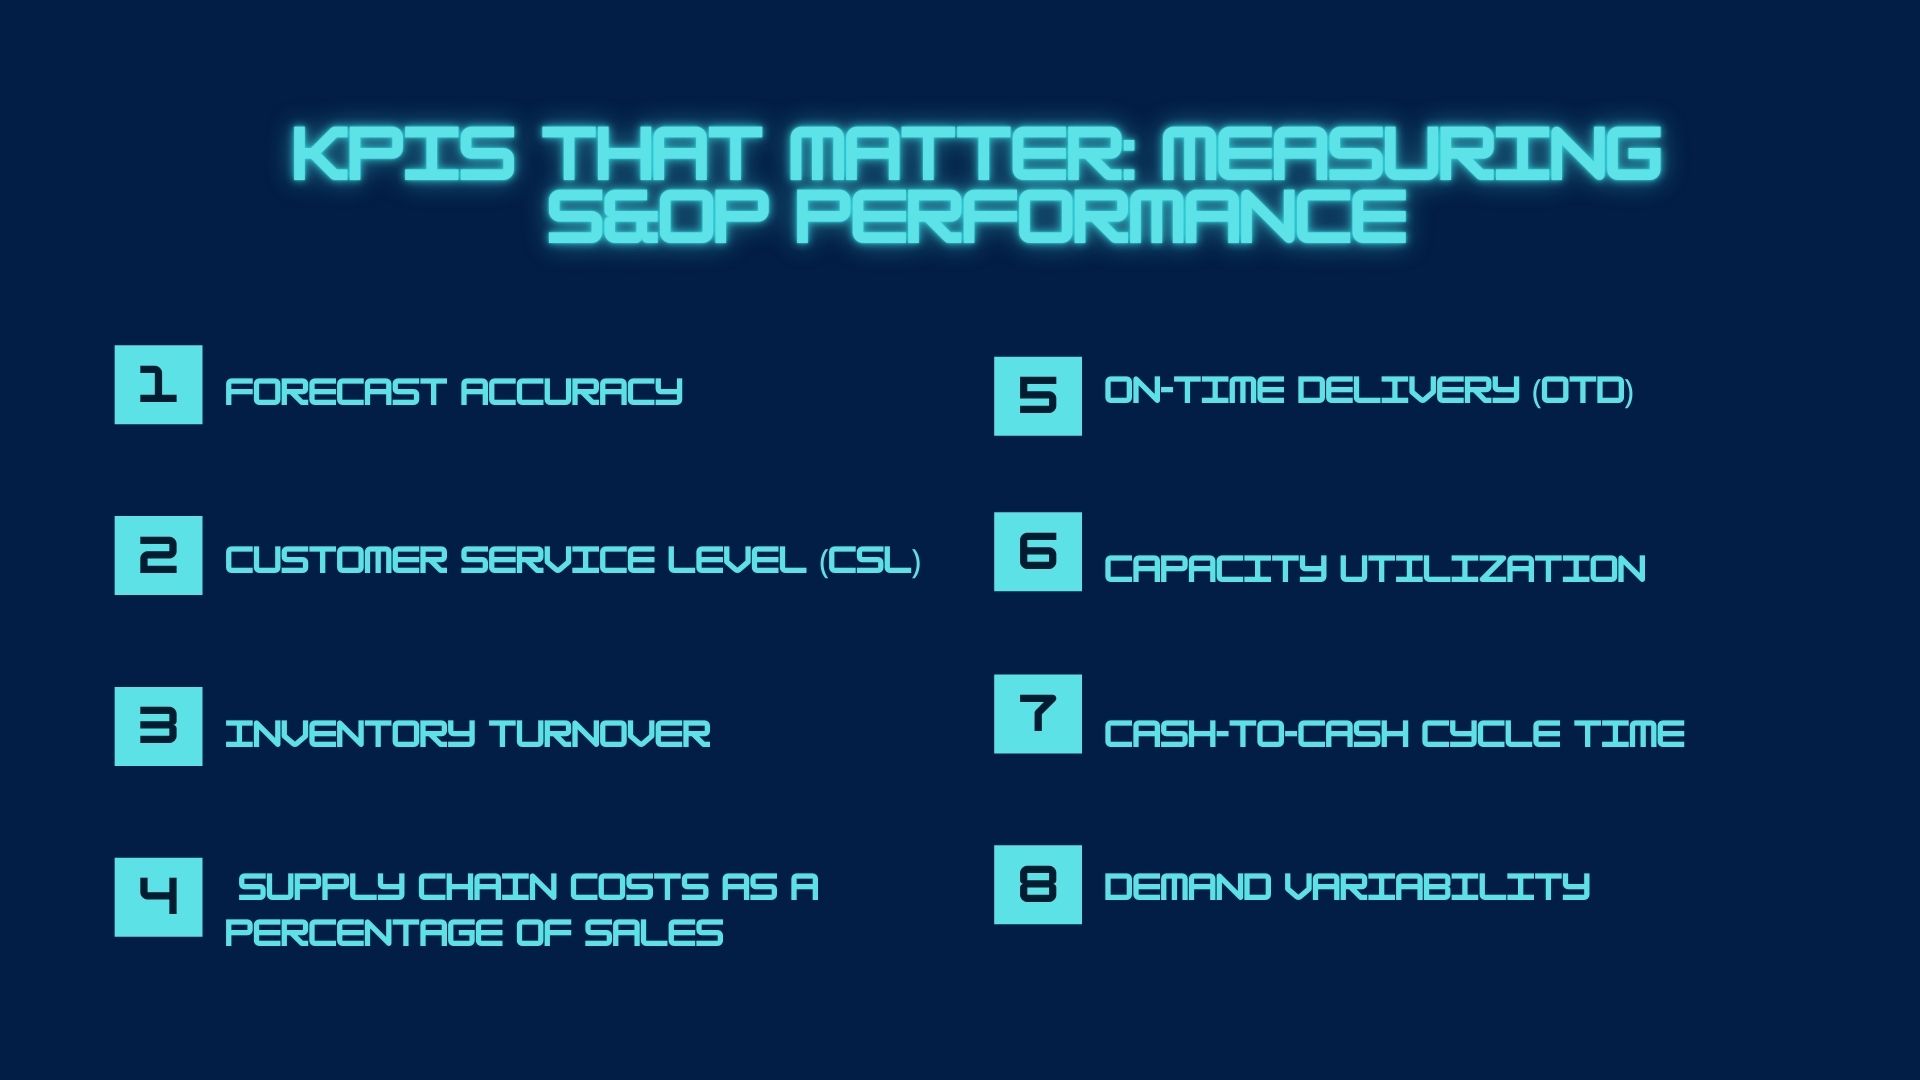
2. Customer Service Level (CSL)
What it is: Customer Service Level (CSL) is a measure of a company’s ability to meet customer demand without stockouts or delays, often expressed as a percentage.
Why it matters: A high customer service level indicates that the company can fulfill customer orders on time, in full, and without delays. Low customer service levels, however, can result in dissatisfied customers, lost sales, and a tarnished reputation.
How to measure it: CSL is typically calculated by dividing the number of orders fulfilled on time and in full by the total number of orders, then multiplying by 100.
Formula:
CSL=(Orders Fulfilled On Time and In FullTotal Orders)×100\text{CSL} = \left( \frac{\text{Orders Fulfilled On Time and In Full}}{\text{Total Orders}} \right) \times 100
Actionable Insight: Maintaining high CSL requires good alignment between supply chain operations and demand forecasting. If CSL is low, businesses should analyze their supply chain processes, production planning, and inventory levels to identify areas of improvement.
3. Inventory Turnover
What it is: Inventory turnover measures how quickly a company sells and replaces its inventory within a certain period.
Why it matters: High inventory turnover indicates that products are selling quickly, which improves cash flow and reduces holding costs. Conversely, low inventory turnover suggests that the company is holding onto excess stock, which ties up capital and may lead to obsolescence.
How to measure it: The inventory turnover ratio is calculated by dividing the cost of goods sold (COGS) by the average inventory value over a specific period.
Formula:
Inventory Turnover=COGSAverage Inventory\text{Inventory Turnover} = \frac{\text{COGS}}{\text{Average Inventory}}
Actionable Insight: A high turnover rate means that the company is efficiently managing its inventory and minimizing excess stock. If turnover is low, businesses might need to reassess their demand forecasting, production scheduling, or inventory policies to prevent overstocking.
4. Supply Chain Costs as a Percentage of Sales
What it is: This KPI tracks the total cost of managing the supply chain (including procurement, logistics, warehousing, and production costs) as a percentage of total sales.
Why it matters: Keeping supply chain costs in check is crucial for profitability. Rising supply chain costs can erode margins and reduce the overall efficiency of the S&OP process. This KPI helps identify inefficiencies and areas where cost optimization can lead to better financial outcomes.
How to measure it: Supply chain costs as a percentage of sales is calculated by dividing total supply chain costs by total sales and multiplying by 100.
Formula:
Supply Chain Cost % of Sales=(Total Supply Chain CostsTotal Sales)×100\text{Supply Chain Cost \% of Sales} = \left( \frac{\text{Total Supply Chain Costs}}{\text{Total Sales}} \right) \times 100
Actionable Insight: A high percentage suggests that supply chain inefficiencies are impacting profitability. By streamlining operations, renegotiating supplier contracts, or optimizing transportation and warehousing, businesses can reduce these costs.
5. On-Time Delivery (OTD)
What it is: On-Time Delivery measures the percentage of orders delivered by the promised date.
Why it matters: Meeting delivery deadlines is critical for maintaining customer satisfaction and loyalty. A failure to deliver on time can result in customer dissatisfaction, lost sales, and damaged relationships. OTD is closely linked to production scheduling, inventory management, and supply chain reliability.
How to measure it: OTD is calculated by dividing the number of orders delivered on time by the total number of orders, and then multiplying by 100.
Formula:
OTD=(Orders Delivered On TimeTotal Orders)×100\text{OTD} = \left( \frac{\text{Orders Delivered On Time}}{\text{Total Orders}} \right) \times 100
Actionable Insight: Low OTD percentages suggest that the company may need to optimize its production and shipping processes, or that there may be delays in the supply chain that need to be addressed.
6. Capacity Utilization
What it is: Capacity utilization measures the extent to which a company is using its available production capacity.
Why it matters: High capacity utilization indicates that the company is making the most of its resources, while low utilization suggests underused assets and inefficiencies. By optimizing capacity utilization, businesses can better align production with demand, reduce costs, and avoid unnecessary capital investments.
How to measure it: The capacity utilization rate is calculated by dividing actual production by maximum production capacity, and then multiplying by 100.
Formula:
Capacity Utilization=(Actual ProductionMaximum Production Capacity)×100\text{Capacity Utilization} = \left( \frac{\text{Actual Production}}{\text{Maximum Production Capacity}} \right) \times 100
Actionable Insight: Low capacity utilization could signal the need for process improvements, better demand forecasting, or adjustments to production schedules. Conversely, consistently high capacity utilization may indicate the need for additional resources or investment in new facilities to meet demand.
7. Cash-to-Cash Cycle Time
What it is: Cash-to-cash cycle time measures the time it takes for a company to convert its investments in inventory back into cash through sales.
Why it matters: A shorter cash-to-cash cycle means that the company is generating cash from sales more quickly, which improves liquidity and financial flexibility. Long cycle times can result in working capital constraints and inefficiencies in inventory and production planning.
How to measure it: This KPI is calculated by adding days of inventory outstanding, days sales outstanding, and subtracting days payable outstanding.
Formula:
Cash-to-Cash Cycle=Days Inventory Outstanding+Days Sales Outstanding−Days Payable Outstanding\text{Cash-to-Cash Cycle} = \text{Days Inventory Outstanding} + \text{Days Sales Outstanding} – \text{Days Payable Outstanding}
Actionable Insight: A long cash-to-cash cycle can indicate inefficiencies in inventory management or accounts receivable. Businesses should focus on improving inventory turnover and optimizing accounts receivable collections to shorten the cycle.
8. Demand Variability
What it is: Demand variability measures how much demand fluctuates from the forecasted or average demand over a period.
Why it matters: High demand variability can create challenges in planning and resource allocation. Businesses that face large swings in demand need to be agile in their operations to quickly scale production and adjust inventory levels. By understanding and managing demand variability, companies can improve their ability to respond to changes in the market.
How to measure it: Demand variability can be calculated using the coefficient of variation (CV), which is the standard deviation of demand divided by the average demand.
Formula:
Demand Variability(CV)=Standard Deviation of DemandAverage Demand\text{Demand Variability} (CV) = \frac{\text{Standard Deviation of Demand}}{\text{Average Demand}}
Actionable Insight: High demand variability may signal the need for better forecasting techniques or adjustments to inventory levels and production scheduling to reduce uncertainty and improve responsiveness.
Conclusion: Measuring S&OP Success with the Right KPIs
KPIs are essential for understanding the effectiveness of your S&OP process. They help businesses evaluate their performance, identify bottlenecks, and make data-driven decisions to optimize operations. The KPIs discussed above—such as forecast accuracy, customer service level, inventory turnover, and on-time delivery—offer valuable insights into different aspects of the S&OP process.
By regularly tracking and analyzing these KPIs, organizations can improve alignment between departments, reduce inefficiencies, enhance customer satisfaction, and achieve their overall business goals. The right KPIs, when monitored closely, will provi
Sales and Operations Planning (S&OP) is a vital process that bridges the gap between different functions within an organization, aligning sales, marketing, finance, and operations to ensure smooth and efficient business operations. However, for S&OP to truly drive value, businesses need to have clear visibility into how well the process is performing. This is where Key Performance Indicators (KPIs) come in.
KPIs are the metrics that help organizations measure the effectiveness of their S&OP initiatives, ensuring they are meeting their goals, delivering value, and continuously improving. In this blog, we’ll define and explore the most critical KPIs for assessing S&OP performance and how they can be used to drive better decision-making and performance.
1. Forecast Accuracy
What it is: Forecast accuracy measures how closely actual demand matches the forecasts made during the S&OP process.
Why it matters: Accurate demand forecasting is the cornerstone of an effective S&OP process. Forecast accuracy directly impacts inventory levels, production schedules, and customer service. If forecasts are too high, businesses risk overstocking and tying up capital in unsold inventory. If forecasts are too low, they risk stockouts, missed sales, and dissatisfied customers.
How to measure it: Typically, forecast accuracy is calculated using Mean Absolute Percentage Error (MAPE), which compares the forecasted demand with the actual demand.
Formula:
MAPE=1n∑i=1n∣Actual Demandi−Forecast DemandiActual Demandi∣×100\text{MAPE} = \frac{1}{n} \sum_{i=1}^{n} \left|\frac{\text{Actual Demand}_i – \text{Forecast Demand}_i}{\text{Actual Demand}_i}\right| \times 100
Actionable Insight: Consistently high forecast accuracy leads to better resource utilization and higher customer satisfaction. If accuracy is low, you may need to revisit your forecasting methods or incorporate more real-time data to improve your process.
de the visibility necessary to ensure that your S&OP process is both effective and agile, enabling your organization to adapt to market changes and thrive in a competitive landscape.